Puck retrievals. They can be a mundane part of the game, but a very important one. Whether it’s starting a breakout, evading pressure or generating a rush chance, most of the time it begins with quickly getting the puck out of the zone. It’s a big reason why I made some big changes to my zone exit tracking starting this season.
Previous years, zone exit tracking was pretty straightforward. You charted which player carried, passed or cleared the puck out of the zone (unless they turned the puck over which goes without saying). More context was added in later years, like forecheck pressure and given credit to players who assisted on exits, but over time things started to get stales.
Pure zone exits ended up being a good stat to gauge players who drove offense, but with shot assists from the defensive zone already being tracked, tracking both felt redundant. That and there’s a lot of valuable information left on the table. Think of how any breakout works in hockey. It’s never as simple as just getting the puck out of the zone, as easy as Cale Makar and Adam Fox make it look sometimes. It usually takes a couple of passes or a few sequences of evading pressure before the puck eventually gets out. That and there’s usually more than one player involved.
You have the defender going back to retrieve the puck, one player as a support outlet (who will usually make the first pass) and a forward posted up high or along the wall to make the final play out of the zone. It’s a team effort and I felt like a lot of it got lost with how I tracked exits in past seasons, as the player getting the puck out of the zone is the one who got credit. You had a lot of guys who were “good at zone exits” without anyone really knowing what it means or if it led to any results. Thus, I flipped things around to look at where the breakout originated instead of just looking at the final play. That’s taken into account too, but more focus is placed on the retrieval.
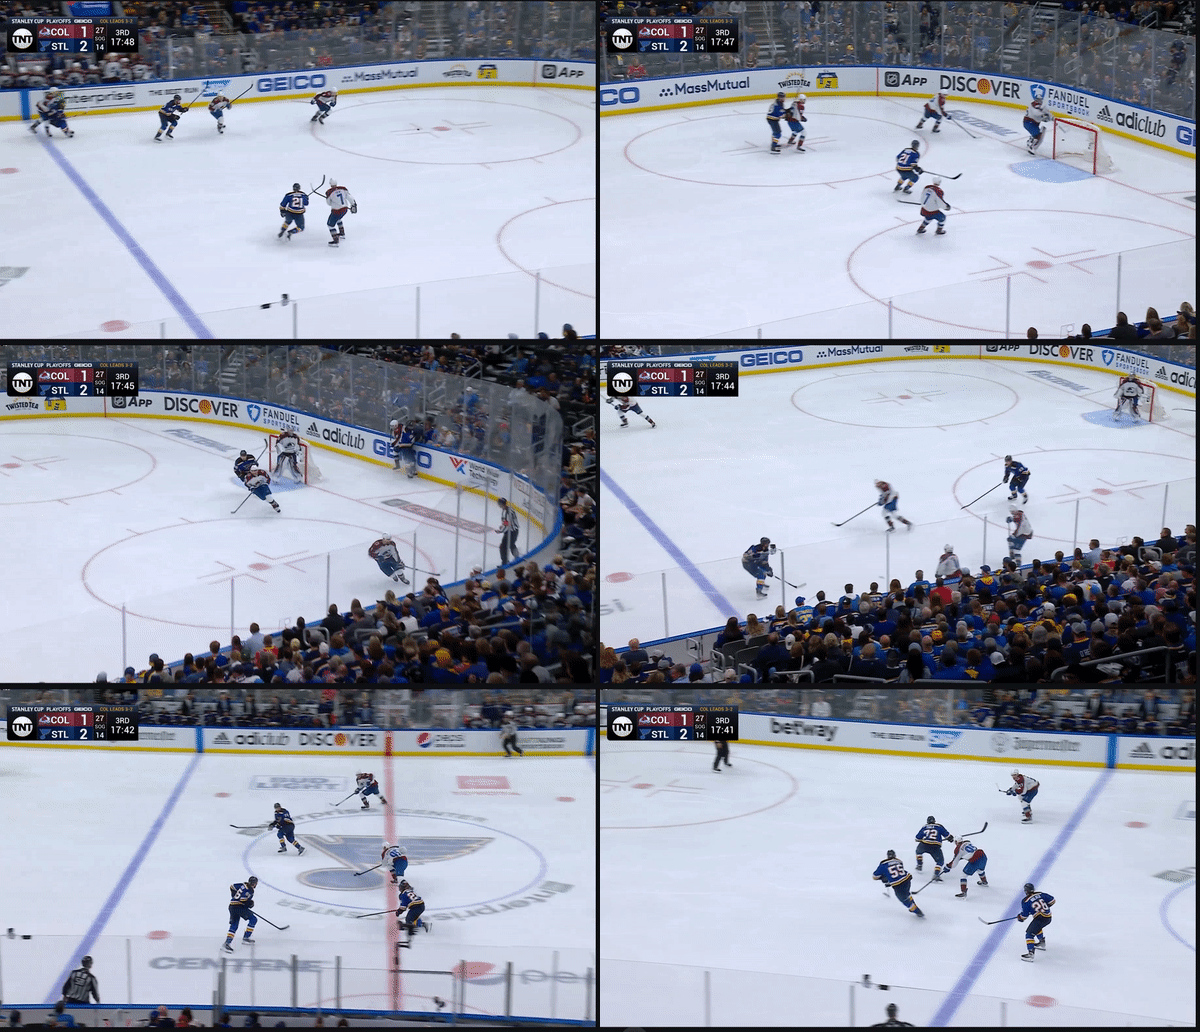
Take a play like this for example.
The defenseman going to retrieve the puck is going to receive more credit for the zone exit here instead of the winger getting the puck out of the zone. Exits are now only tracked if there’s a chance to retrieve & make a play up the ice with the puck, as opposed to any instance of attempting to exit the zone under pressure. At the end of the day, we’re looking to track repeatable skill & the defender who has to make the play under pressure is likely going to be more of what we’re looking for than a player being in good position to complete the exit, if we want to identify talent. Both will get credit, but the defender making the first pass will get more credit for leading the transition here. It might tell us more about a player defensively too, as players who can make that first pass & avoid pressure consistently are likely going to produce better defensive results.
So, how do you start with this? It’s pretty similar to my old exit tracking, except the player “assisting” on the pass is going to be where the focus is. We track if he retrieved the puck successfully & made a play to a teammate (or exited the zone himself). If he fumbles the puck, turns it over, chops it off the boards out of the zone or makes a play to nobody, he is charged with what I call a “botched exit.”
A successful exit can come off these but it’s not ideal, since you have a teammate cleaning up your mistake. Sometimes the recipient will be charged with a botched exit if they fumble the pass or are out of position when a play is coming to them, although it doesn’t happen as often as you think. You can also get charged with a failed exit off a retrieval, which is self-explanatory.
Other categories from exit tracking are also included here, namely forecheck pressure as we can look at that to see who is helping keep plays in the offensive zone. You can get a lot of info from just tracking this element of the game, as a breakout can have a lot of layers to it and looking at it can be complicated at first. That and there’s more than one way to exit & things get messy in the doldrums of a game. You have a lot of back-and-forth play & breakouts that lead to nowhere, which I tend to skip if it doesn’t lead to any shots or the breakout ends up being completed anyway.
This is one where things get a little complicated. Rangers fail to exit the zone but they end up getting it back and exiting on their second try. This is one of those circumstances where you read the situation at hand. The first exit would get thrown out because the Rangers recovered the puck on their second try. However, the retrieval would go to Lindgren instead of Fox, as he had to make a play under pressure to help get this out. Had the Lightning recovered the puck, it would have been different but we want to create as less noise as possible when tracking this much data. So through that we have potential data on retrievals from a defensive perspective, zone exits from an offensive perspective and some possible forechecking stats from the other side.
As far as what constitutes a successful exit, I count it as anything that clears the blue line (unless it goes directly to the other team). Anything that’s not a direct turnover or intentional clear out of the zone is tracked as a “missed exit.” Meaning it got out of the zone, but it’s graded as a wasted chance at transition & offense. Missed passes vs. intentional clears can be a bit of a judgement call, but that’s where you go with what you see. Easy to tell an off-target pass from a defender just trying to relieve pressure, which has its place in the late stage of the game (especially in the playoffs. Both are recorded as exits without possession in the broad sense, but this data can be broken down into a pretty granular form so you want to make sure you have all your boxes checked.
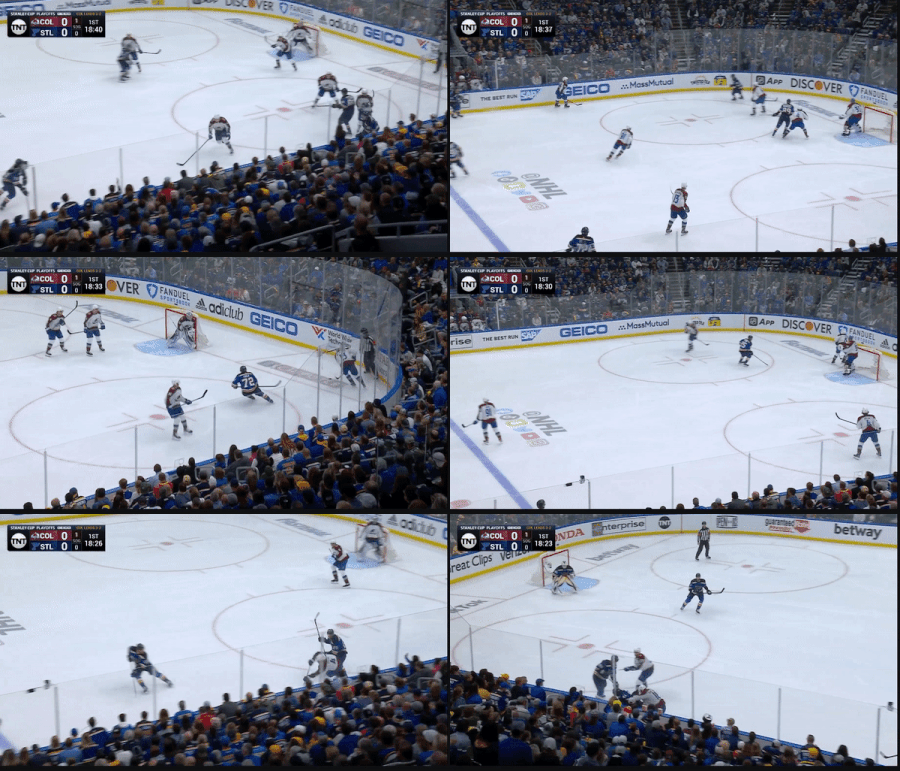
This play would be charged as a retrieval and a failed exit for 18STL, rather than a failed exit by 65STL. The reason being that he cleanly retrieves the puck, but delivers an off-target pass to the winger, which clears the zone but Colorado ends up getting possession, which means the Blues have to stay on defense. The camera angle makes it tough to tell if 65STL had possession before getting checked, but 18STL had time to make a play & his pass was in 65’s skates while he was in an awkward position, so there was little change of him making anything out of the initial pass. This is where some context needs to be applied when you’re tracking the games because things aren’t always black-and-white.
Grey Area
This is another tough one because it’s off a line change & the Blues initially concede the zone once COL13 retrieves the puck and then apply some pressure once they get a change & the Avs have to beat a forecheck to make a play. What we do here is give 13 the credit for the successful retrieval & in-zone pass and then track the exit as normal (it’s a missed pass in this instance because 4COL doesn’t connect on the pass and the Blues get the puck back. It’s not a failed exit because they cleared the zone all the way to the other blue line, but it’s also a missed attempt at possession. Had the Blues conceded the zone & applied no pressure, the play would have been thrown out. There’s no sense in tracking exits if a team is just skating the puck out of the zone with no resistance. We’re already tracking entries & passes, so the plays will be captured there if anything of note happens.
One year of data
Now comes the fun part, gathering all the data and trying to make sense of it. Exits and breakouts are probably the trickiest subject to deal with because you have a lot of different datapoints captured with different layers to analyze. It’s hard to say that a player is “good or bad at zone exits” because there’s different parts that go into the breakout with different players contributing. What’s the best way to measure what’s a repeatable skill?
The simplest way to go about this is to look at the categories from a sequence of events standpoint & go from there. I usually think of it as a flow chart.
From then, you frame the stats starting with the retrieval & go from there:
Retrievals: Pretty straightforward. Did the defender retrieve the puck or not. Basically a way to show if the player is doing their job of getting the puck into a good position & starting the possession cleaning. It can also be used to show workload, which can come into handy later. Players with the highest successful retrieval percentage include the likes of Brett Pesce, Miro Heiskanen and Adam Fox, who retrieve about 95% of the pucks they have to recover. The worst include Marc Staal, Marc Borowiecki and Oliver Ekman-Larsson, around the 70% range. No one is worse than Nikita Zaitsev, who somehow only retrieved 66% of the pucks he had to retrieve. In general, most players are good at this but most of your top defenders will rank highly in this & if they don’t, well then maybe teams can frame some of their defensive problems on that.
After the retrieval, the defender can give the puck to another teammate or pass/skate the puck out of the zone. They can also turn it over, which is counted as a botched retrieval. Note that even some of your best retrievers aren’t going to have all of their possessions turn into clean exits, but they do more often than not. Then you can start to form stats such as “retrievals leading to exits” or “exits started.” Players such as Quinn Hughes, Damon Severson, Drew Doughty & Charlie McAvoy lead the league in this stat, a little more convoluted than straight retrieval percentage. Exits that happen off the exchange are given to the teammate, but the player making the initial credit for the exit. Most players good at retrievals will be good at exiting the zone & vice versa, but there’s some notable exceptions. One of which being Nashville’s Roman Josi.
Josi is still a force offensively and at getting the puck through the neutral zone. However, his retrieval numbers are relatively low. At least for his standards. Both Fabbro and Ekholm are doing much more of the work here and while Josi does a lot of work with the puck everywhere else, he isn’t the one starting Nashville’s exits. What this probably means is that the Preds want him up the ice more, so they have a partner designated to retrieving the puck so Josi can get ahead in the play and not have to be a one-man show to enter the zone. The numbers bear that out but lets look at some tape anyway.
You can clearly see what Nashville wants to do here. Get your best player going north and playing offense as much as possible. Ekholm might just be stuck skating backwards for most of his shifts because he’s coming on after Josi leaves the ice, on the fly with the other team coming back on a regroup. It’s one way teams “shelter” their defensemen now since it’s hard to get the matchup you want every night. Josi’s shifts are a little more controlled so he can play to his strengths more while Ekholm can handle some of the tougher assignments.
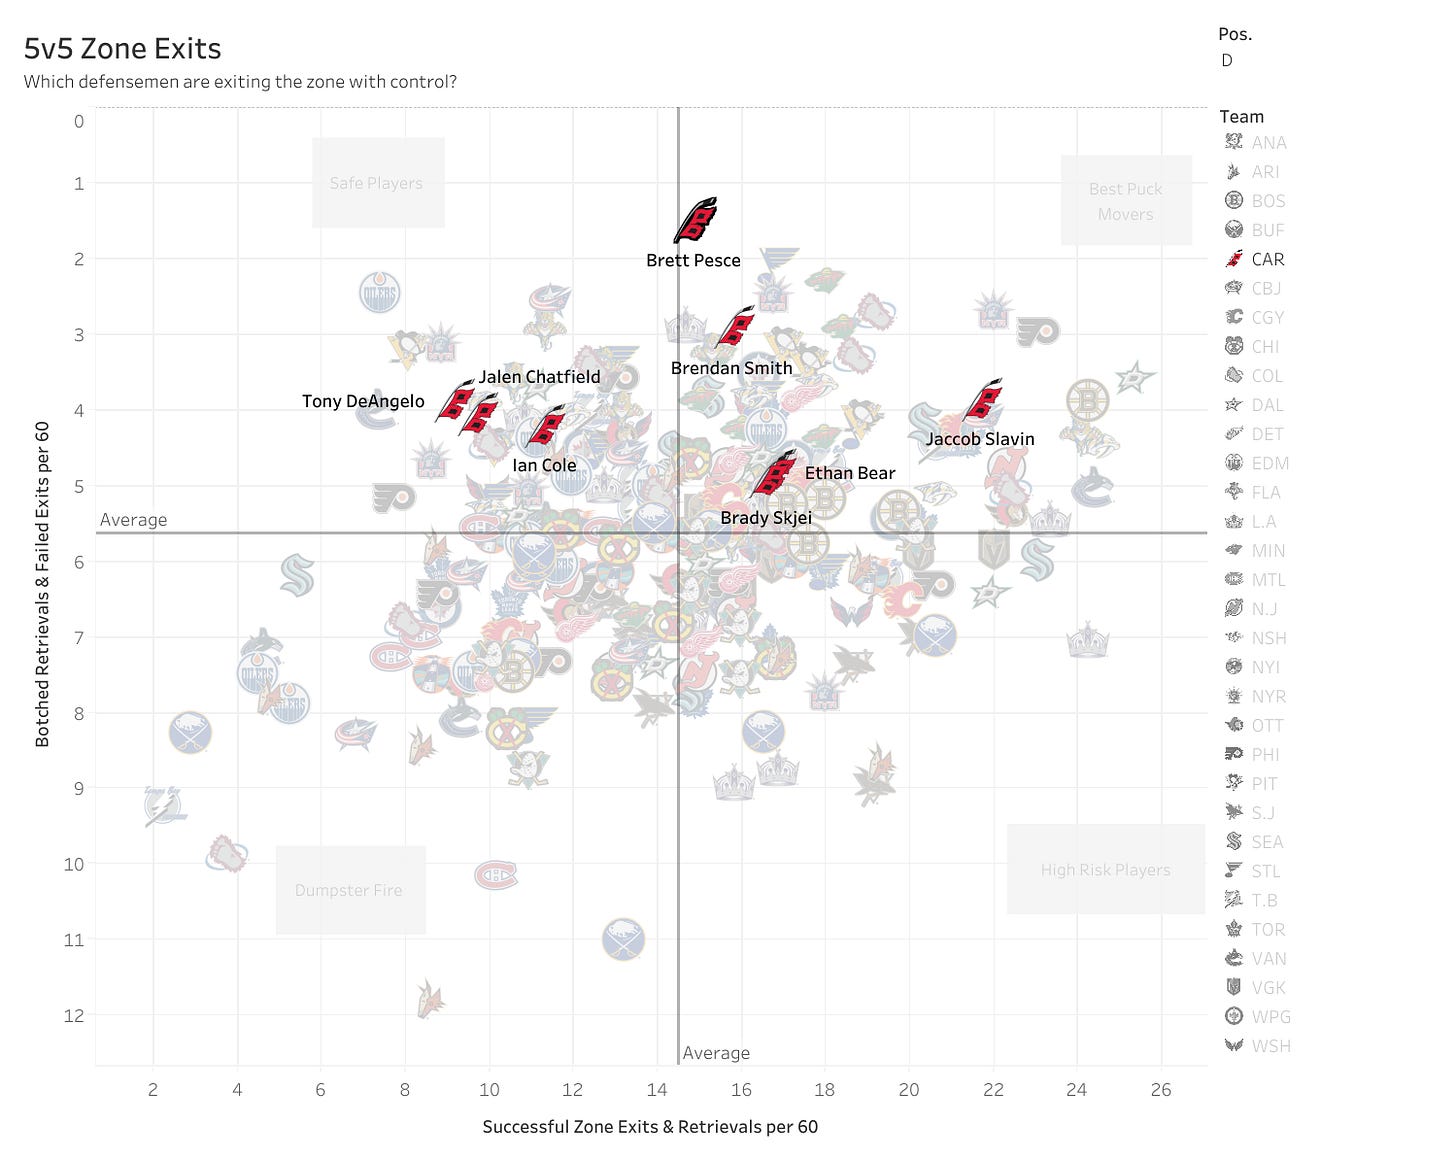
We also see this with the Hurricanes top-four:
There’s a pretty big divide in who handles the puck on the Hurricanes top pair, with Jaccob Slavin doing most of the work. It’s not a huge surprise, given he’s their best defensive player but you might not expect his d-partner Tony DeAngelo to rank so low on the other side, especially given his billing as an offensive defenseman. This is where sheltering come into play. Slavin & DeAngelo start a lot of their shifts in the offensive zone with Slavin doing a lot of the work to get the puck out of the zone if they have to go back. His ability to skate the puck out of pressure & kill plays at the blue line helps DeAngelo make plays without having to deal with forecheck pressure.
The Hurricanes are also a team that doesn’t really care how they exit the zone as long as the puck gets out & they can get a forecheck going, so DeAngelo (or Slavin) don’t have to start a lot of rushes from their own end to be an effective top fair. There’s a ripple effect with the rest of the bottom-four, with Brett Pesce & Brady Skjei having to take most of the defensive shifts against a forecheck & expend a lot of their energy getting pucks out. Not too different from what the Preds do with Josi & Ekholm. It’s a trade-off where you’re banking on the second pair keeping their heads above water so the the top pair can be more free offensively. Gives you a different perspective of how coaches deploy their defense and how it’s not always about matchups.
Of course, some players do not need this type of sheltering or deployment. If you look at the top right of the last chart, you’ll see names like Charlie McAvoy, Miro Heiskanen & Adam Fox. Guys who produce elite results in terms of overall impact (and points for everyone except Miro). Which sort of brings up the question of what to look for in a defenseman and if players who can do everything like this are more valuable than those who just put up big point totals. Although the counter to that is you want coaches to play guys to their strengths and someone like Josi shouldn’t be punished for just playing his role. This also goes back to the earlier point of how this type of analysis is never black & white. You have a lot of different factors to consider, which leads to some interesting player cards. The best example being the league’s top defenseman right now, Cale Makar.
Like Josi, Makar doesn’t retrieve the puck as much as Heiskanen or McAvoy. The reason being is that he is never in the defensive zone under pressure. Which is just a by-product of how good he is and how great of a system Colorado has. His only negative categories are related to workload and it’s because he spends all of his shifts skating downhill with the puck, and when he does have to exit the zone he is among the best in the league at making plays. Sometimes efficiency tells more of a story than just pure frequency stats & that’s the case with Makar.
I’ve been messing around with a “Microstat Game Score” stat over the past couple of years, weighting each component of the stats I track to give players one individual score at the end of games. If we take just the zone exit portion (receiving a positive score for retrievals leading to exits, exits with possession while getting docked for failed exits & botched retrievals), Makar ranks as the best in the league despite the lower workload on retrievals.
What’s interesting is that the playoffs have been a different story for Makar. He’s had to handle a bigger workload on puck retrievals and has absolutely thrived with it. I’m not sure if the increase in puck touches is from more ice-time, him getting tougher matchups or there generally fewer shifts in the playoffs where you can skate out of the zone with no pressure, but he has answered all of those questions, outperforming every single defenseman in the playoffs by a country mile.
Kind of goes back to my earlier point of not wanting to punish players for being a product of their environment or their coaches system. The game changes in the playoff & talent eventually shines through.
Conclusions
I want to get more data tracked (preferably 40+ games of every team) before I start making conclusions, but we have a starting point for improving how we measure breakouts & defensive play. There’s more we could expand on once we get more data. Like if there’s any benefit to simply clearing the zone instead of setting up possession exits, or if players who retrieve the puck have more value even if it’s not leading to a breakout? Are their teammates to blame? Is it a bad system? Or just not that important in the grand scheme? Early results show some signal.


