
Changing Your Game
Changing Your Game
Fixing problems without overhauling what worked before


Teams are always looking for ways to emulate the champion. When Pittsburgh won, it was “we need to get faster.” When St. Louis & Washington won, it was “we need to get bigger. When Tampa went back-to-back, it was “we need to play tougher.” There is always one trait teams want to copy because it’s an easier problem to fix than “we need better players” or having your top players go through a dry spell.
You always hear about how you need to play a certain way to win in the playoffs, but the last four Cup winners couldn’t be more different stylistically. Colorado ran a lot of offense through their quick, mobile defense while Vegas’ has a more physically imposing group that has a minimalist approach to offense. The playoffs last year were all about possession & transition play while this year was more of a grind. Rush opportunities were scarce and teams had to work to get any space in the neutral zone.
What made Vegas stand out this year, and why they went on an unprecedented shooting percentage run, was they could excel in both phases of the game. They had to play a different game than they did in the regular season, but they could take advantage when the game opened up.
General Stats & Takeaways
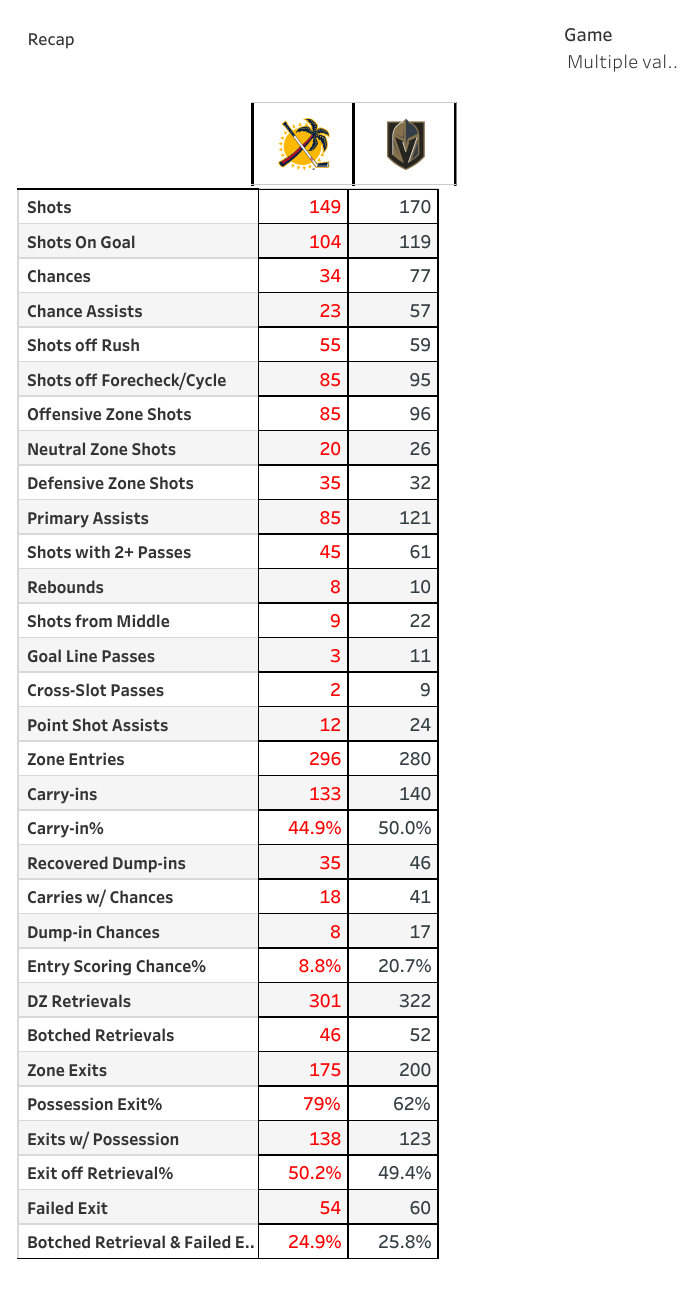
There isn’t much to say about this series because it was a total ass-whipping. You had three close games on the scoreboard & two blowouts, Vegas heavily outchancing Florida in the final three games. The Panthers MO in the first three rounds was to limit rush play & keep the chance count close by disrupting the obvious attack points for teams. For Toronto, they pressured them behind the net and took away net-front plays. With Carolina, they pressured the points, taking away the rebound & deflection chances that were their bread & butter all season.
Against Vegas, they couldn’t slow them down on the rush and when they tried to, it just made the problem worse because Vegas crushed them on the forecheck. The trade-off was that they weren’t scoring as many goals off the forecheck as they were off the rush through the first four games (6 goals on 44 shots vs. 5 goals on 66 shots). It just ended up delaying the inevitable because it’s hard to win when you’re only getting single-digit scoring chances every game. Maybe Florida thought they could lean on Bobrovsky if they kept the play mostly in-zone instead of having him deal with the Knights skating right at him. They took a beating on the chance count & limited their own offense, but it worked in the first three rounds.
The problem was Vegas had already seen this before, as did most teams. The playoff field was made up of a dead even split of teams that liked carrying the puck in vs. playing dump-and-chase, Vegas being a team that prefers controlled entries.
Changing Your Game
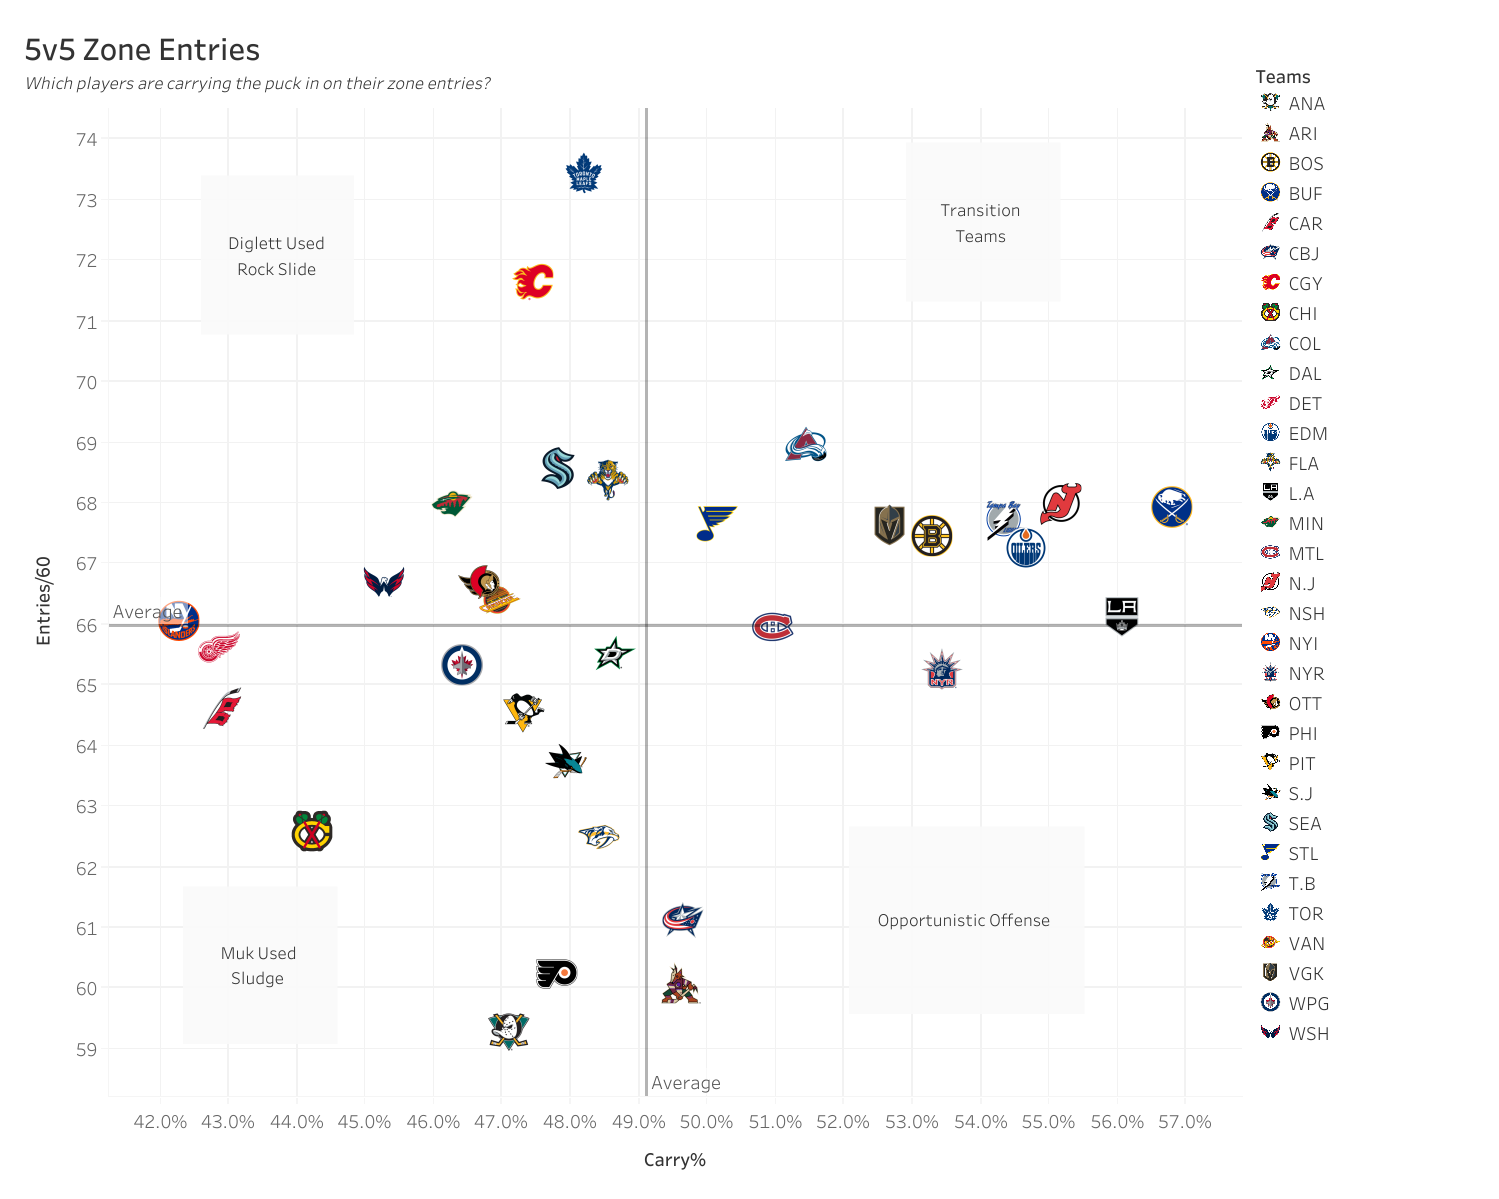
The landscape looked much different in the playoffs:
This isn’t how the playoffs go every year (things were much more possession-dominated last season), but the forecheck was everybody’s go-to this season. New Jersey was the only team who carried the puck in at a rate over the league average and Vegas was only the second team to have a controlled entry rate at 50% or higher in a series. It took them until the Stanley Cup Final to do that & it was against the team that leaned into their forecheck the most this post-season.
Teams had to break their mold & play outside their comfort zone. Vegas didn’t really have a problem with that even if they took a couple gut-punches in the earlier rounds. Part of it is because the rush game was such a strength for them in the regular season that they could capitalize when the pace started to pick up. The thing about zone entries is that in the playoffs it’s less about carrying the puck in quantity & more about picking your spots to capitalize when things start to open up.
Defenses are tight and there’s not much space when defenses can stack you up in the neutral zone or dealing with forecheck pressure. Hockey isn’t a strict, rigid game and there are going to be opportunities to create off things like turnovers, misplays or extending a defensive shift to flip possession. It shows with the balance in how they scored their rush goals.

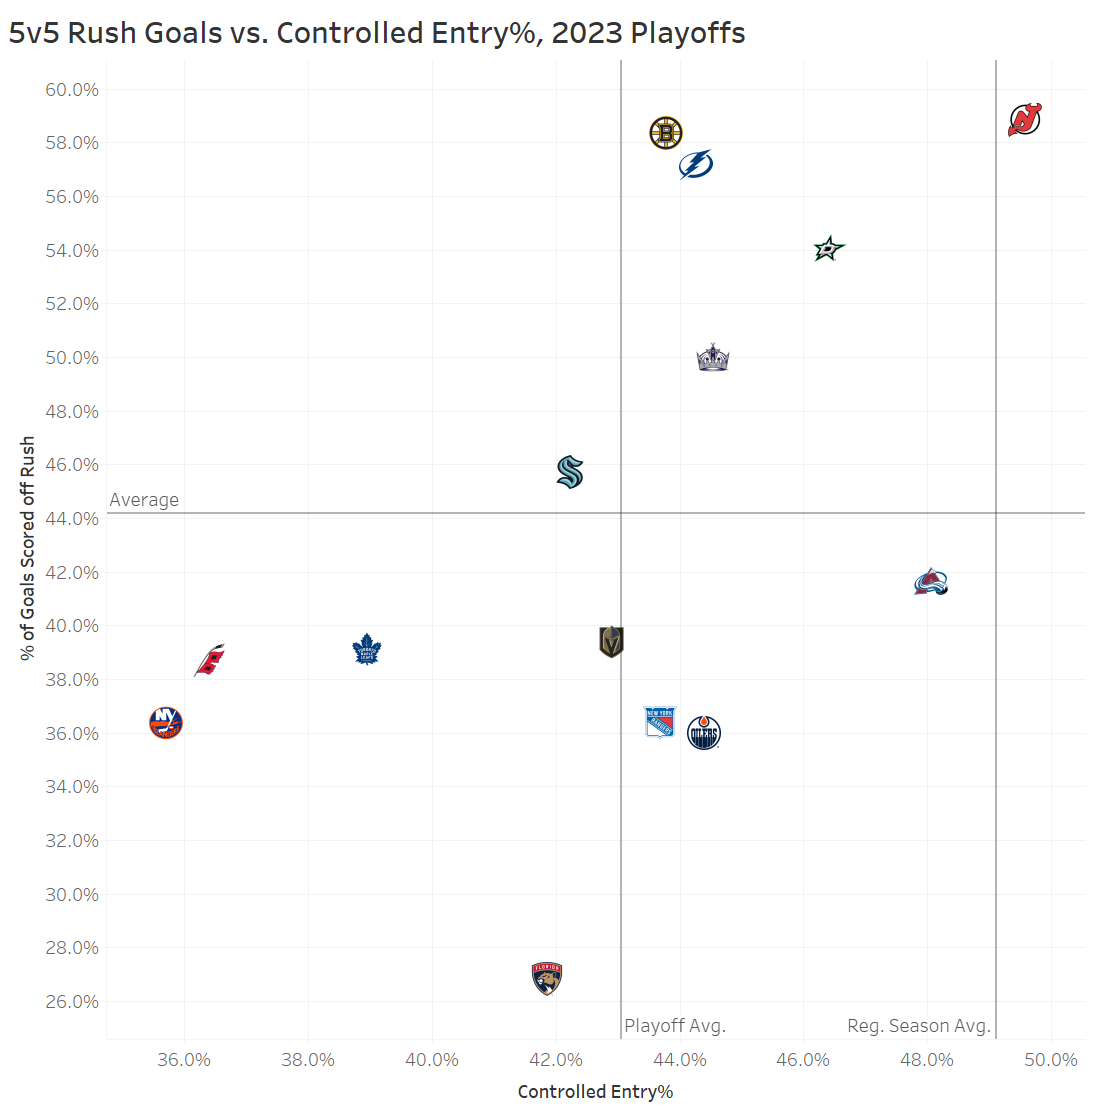
This looks at which zone a rush goal originated from. A higher percentage of neutral zone goals are scored off turnovers or regroups where it’s a quick-strike type of play. Defensive zone rush goals are either off a counter-attack from high in the zone or a breakout against a forecheck. A very low percentage of them come from controlled breakouts or a neutral zone regroup. An interesting thing about these playoffs is teams seemed to get most of their rush goals from one zone the other. Vegas is one team that had the balance (along with Tampa who got bounced in the first round but sample sizes will fuck up all graphs).
In my recap of the Dallas series, I talked about how they were one of the easiest teams to “fix” because they were one of a few teams who could score goals off neutral zone reloads when Pete DeBoer was their coach. The rub was they weren’t getting anything off the forecheck and played a stagnant low-to-high offense. Bruce Cassidy seems to have fixed that. Vegas’ rush offense didn’t need tweaking, but it couldn’t be their only threat. In the playoffs, you saw a lot of one area of the game supporting the other. Vegas could score goals off puck recoveries from controlled entries or catch teams on bad line changes with quick reloads after long shifts in the offensive zone.
It’s just part of changing how you play without overhauling what worked for you before. Someone who exemplifies that is the Conn Smythe winner Jonathan Marchessault. A staple in Vegas since he was taken in the expansion draft, he is consistently one of their top goal-scorers and play-drivers. He likes the puck on his stick and is usually one of the guys they defer to for zone entries, mostly because he has that quick-strike ability and can attack with a lot of speed or just get the puck deep & get to work on the forecheck.
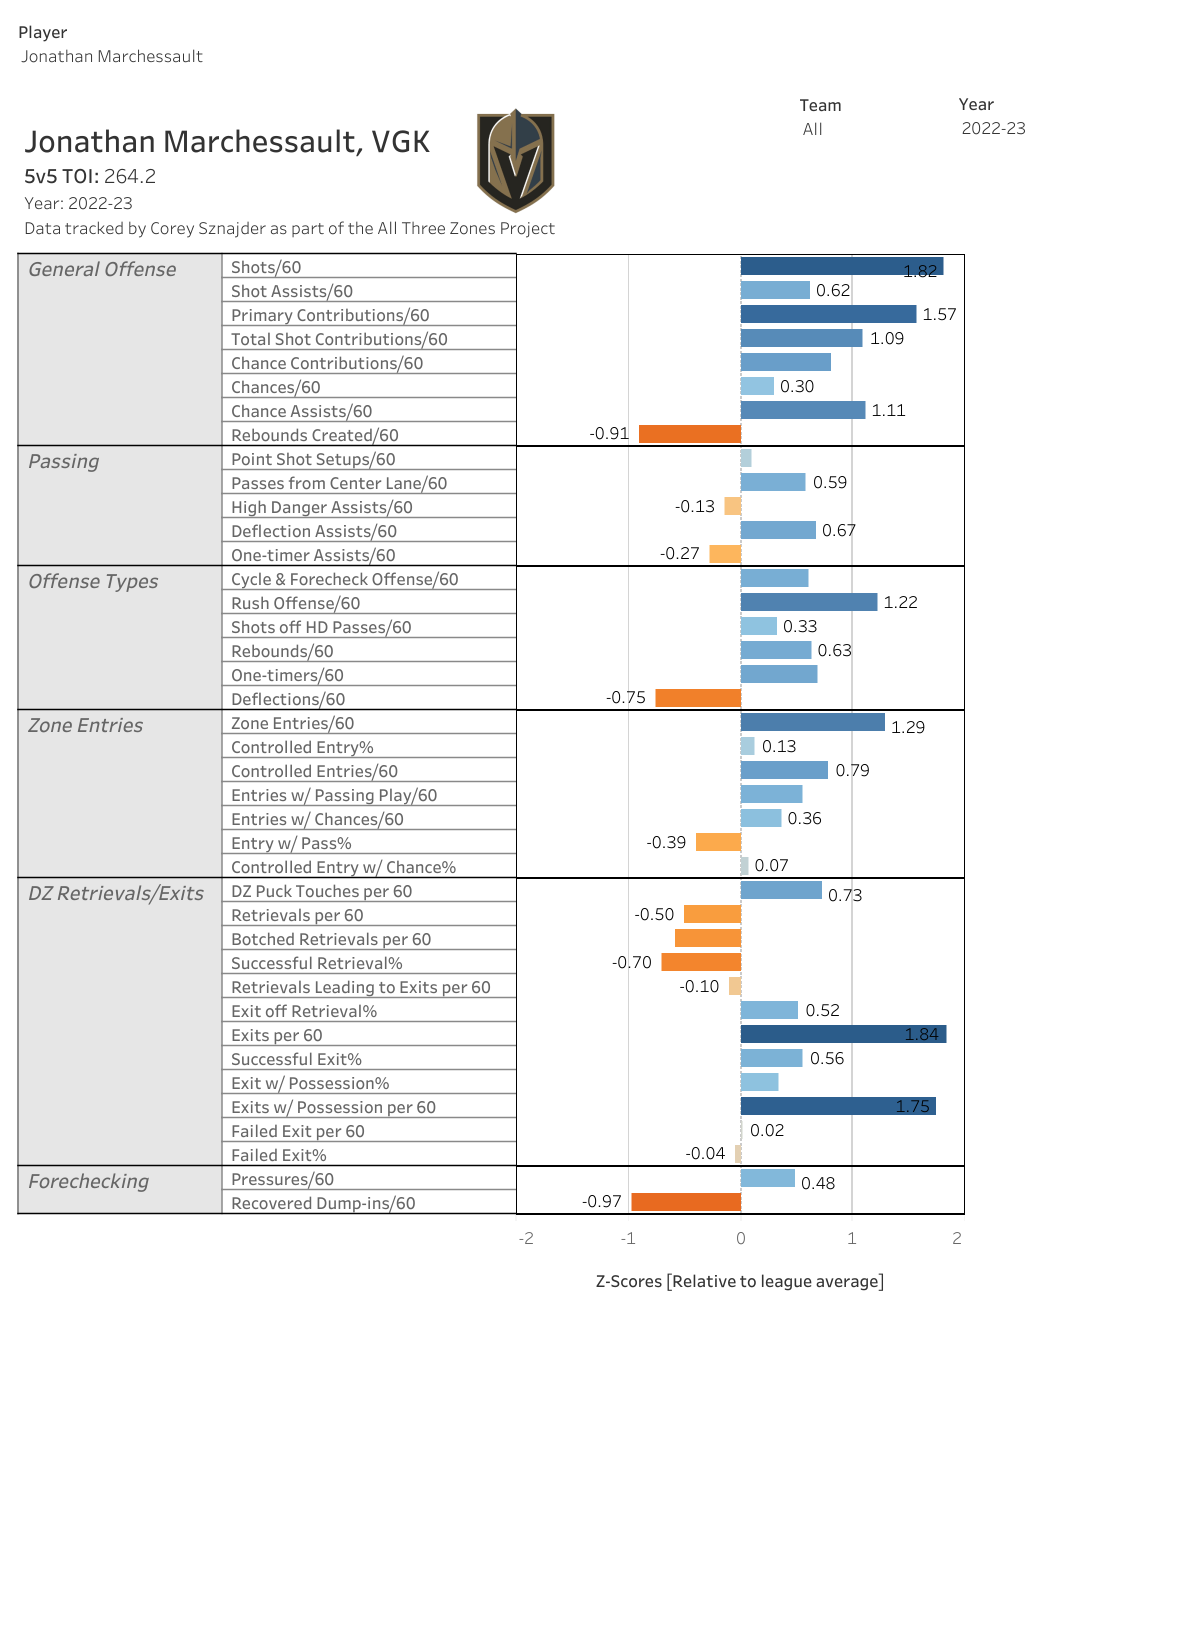
In the playoffs, it was a little different. They used him on a line with Jack Eichel & he played more of a supporting role, playing off the puck and letting Eichel do most of the bull-work in the neutral zone. Instead of quarterbacking the play & looking to go end-to-end, he looked for ways to get open and create easy give-and-go touches to help Eichel get loose in the neutral zone.
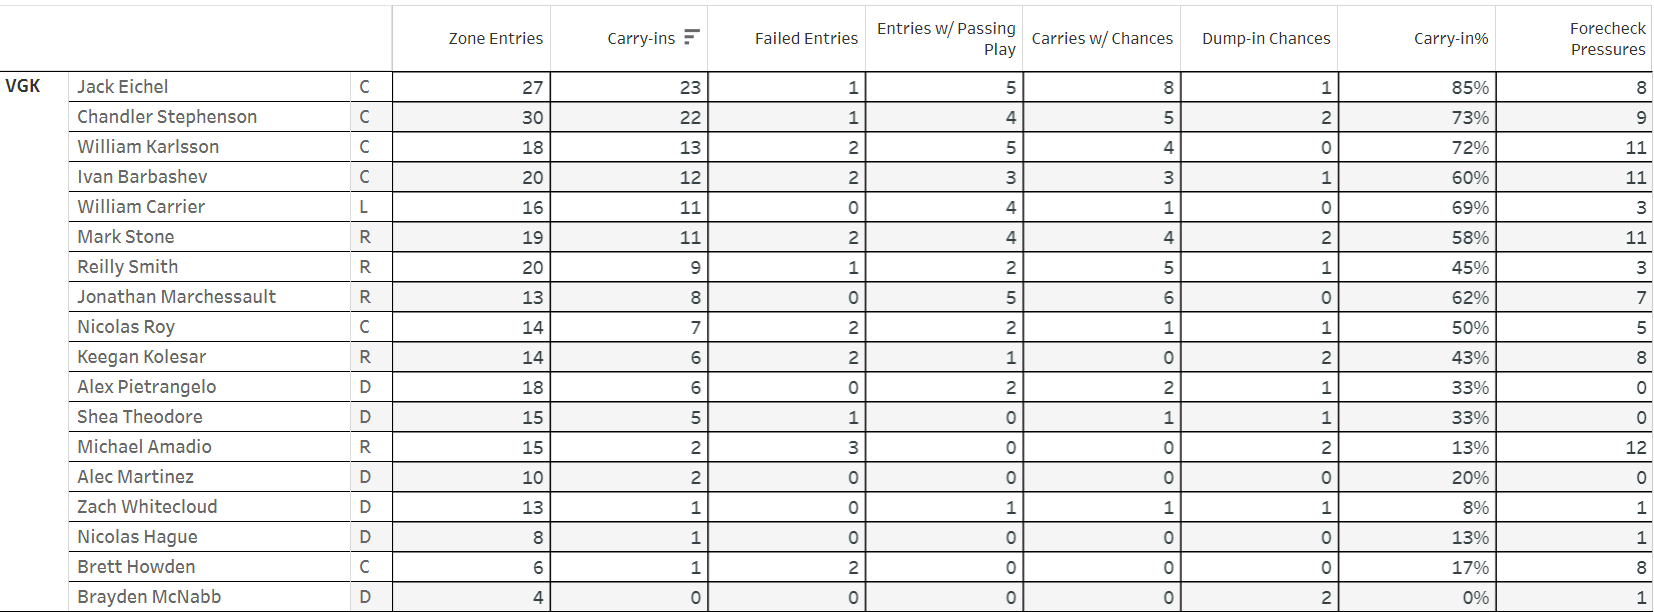
You might say he took a backseat here, but a key stat is that a high percentage of his zone entries led to scoring chances. This was especially true in the Final where 6 of his 8 controlled entries led to a Vegas chance, which was second on the team behind Eichel. Most of the offense ran through Eichel and while Marchessault played more of a supporting role, he could be a driver if he needed to. That and not having to be “the guy” to carry the puck in all three zones allows him to find other ways to create open looks.
A relationship like this is usually a two-way street. Vegas has seen a lot of it with their original Misfit Line relying so much on Marchessault’s puck-handling with Karlsson & Smith making quick, “touch-and-go” type of plays to him. With Eichel, the role is reversed a little. It means Marchessault had the puck on his stick less & played more stationary in the neutral zone, but it’s hard to argue with the results.
It requires a lot of trust from Marchessault to pull this off. He’s the one still having to play fast while also coming to a dead stop or going against the grain while the play is heading north. Both Eichel & Barbashev did a tremendous job of hunting down pucks & turning these chip plays into controlled entries, which then led to dangerous chances as it helped Vegas get numbers behind Florida’s aggressive defense in the neutral zone. Everything worked in perfect unison & sometimes chemistry like this can lead to a team going on a historic run of shooting & goaltending in the playoffs.
Marchessault moved to a new line & had to change parts of his game to fit in with a dominant player like Eichel. It didn’t mean he had to change everything about how he played. Just like Vegas had to change parts of their game in this playoff run, while also not overhauling everything that made them good for the previous six years.
Out of curiosity, where do you source the data used in your graphics? Like carry %, is that something you're calculating or is that already recorded somewhere else? (Trying to find data to make my own analyics)