Seattle & Self-Reflection/Connecting The Dots
Adding context to separate the control from the chaos of rush offense
I always look forward to whenever there’s a hockey analytics conference. You get to reconnect with some old friends, meet some people who you’ve only talked online with(including some of your old bosses) and get introduced to some new faces & ideas in the hockey circle. For me, it’s one of the few times I get to actually talk about All Three Zones and present some ideas that I might otherwise throw out into the Twitter void at 3 AM. How to present those ideas is always a challenge because there’s 500 different points I can get into, which then splinters into 1000 tangets where I dive into the details. Scaling it down to a presentation helps bring some element of control to my talk so I don’t galaxy brain my entire project or lose the entire room.
It’s also easy for me to psyche myself out when I go to these. I don’t have a ton of reps with actually talking about my projects and I always feel underqualified even when I get accepted to speak. Whether it’s my lack of math background, team experience, further education or my entire career being a one-man operation, I have a tendencies to go into these feeling the need to prove myself & that I belong. It usually ends up in me doing something that’s beyond my reach and over-thinking everything I said on the podium the second the presentation is over.
I actually went back and rewatched some of my presentations from other conferences before going to Seattle and my takeaway from it was less about the information and more “dude, you fucking hate yourself.” There isn’t a single person in that audience that wants to be impressed by whatever you have to say. Most of them know you and just want to see you do your thing & be yourself. Granted, doing that is tough when you’re your harshest critic, but the general insecurity of trying to say more than you’re capable of and not just being in the moment is definitely what I regret the most when I look back on some of my old work. This is what I had to remind myself of with the Seattle conference. The audience is smart, but they’re also your friends, not your Twitter mentions who are going to judge your experience and point out every incorrect thing you said.
Collecting the data for this project was a lot of hard work, but getting over the mental hump of putting yourself out there was 100 times tougher. Even if I’ve done it before and have a small online following. I just had to remember who the audience is, people who just want to see you be yourself and maybe learn something fun along the way. SEAHAC was exactly this.
It’s why I’m grateful for the work Alison, Ryan & others do when they put these conferences together. You get a lot of people who have done the circuit before & others who are putting themselves out there for the first time. Everyone is there to support one another regardless of their background or experience, though. Sometimes it takes a few tries to feel comfortable on the podium but everyone is there to encourage you and make it a fun experience. Plus you get to put a face to the countless Twitter accounts you discuss with online.
Now that the sappy post is out of the way, let’s get into what my presentation was.
Connecting the Dots: Rush Goals & Context
This is going to be short because I don’t want to just transcribe my SEAHAC presentations, but the presentation was basically an abridged version of All Three Zones with some expanded detail. I had a conversation with someone over the summer (hi if you’re reading this) that asked me about where most rush goals began & if there’s any real benefit to regrouping in the neutral zone vs. playing strong in the defensive zone and generating rush chances that way. It got the wheels clicking in me and I started tracking which zone each shot originated from this season. I don’t have nearly enough data tracked from this season to do a project on it, so instead I watched every five-on-five goal from last season (minus outdoor games) and charted the following:
Which goal the zone originated from (offensive, neutral, defensive)
The basic A3Z data (shooter, shot type, passers, pass type, rush/forecheck), with extra notes on assists that came off rebound & deflection goals.
Puck movement & certain passing plays (trailers, give-and-gos, stretch passes, wide zone entries, zone entries with a middle-drive, odd-man rushes, controlled entries that turned into cycles). I tracked puck-movement on all goals for a few teams, but scaled it down to only rush goals for everyone else because the process was taking forever & I needed to dial it back
The “context” of the rush goal. More on that in a second
What I mean by “context” of the rush (because I couldn’t think of a better word) is whether or not the rush was generated off a turnover or a play where the team had some element of control. A rush off a neutral zone giveaway or a blocked shot is different than one where you peel back and wait for a better play to develop. Just like a rush goal where you have to beat a forecheck is different than one where the other team is stacked up in the neutral zone. There’s certain things coaches & players can control compared to other events that just kind of happen in a chaotic game like hockey. My goal with this whole project was to separate those out and see if any teams were good at generating some extra rush offense through those controlled plays. I also wanted to see if any players not named Connor McDavid were special at beating defenses that were setup in the neutral zone because those lists are always fun.
To iron out the “context” of the rush, I broke the situation down into six categories with video examples.
Neutral Zone Turnover: Self-explanatory, but basically a giveaway in the neutral zone. Doesn’t have to be direct but all five players have to be onside when it happens.
Neutral Zone Reload: When the puck is cleared out of the defensive zone & the attacking team quickly re-enters with at least one player having to tag-up
Neutral Zone Regroup: Similar to a reload, but all five players have to be onside when the possession is gained & the movement forward isn’t direct. The puck can be brought into the defensive zone for this play but it has to stay above the faceoff dots.
Defensive Zone Counter-Attack: A quick exit out of the defensive zone with no resistance off a failed offensive zone sequence (i.e. a blocked shot, a missed pass, a shot that ricohets back to the blue line). No resistance exiting the zone is the key.
Defensive Zone Retrieval/Zone Exit: A puck recovery in the defensive zone & an exit against the forecheck. Differs from a counter-attack if the exiting player has to beat at least one forechecker.
Controlled Breakout: An exit from deep in the defensive zone with no resistance from a forecheck. Usually happens off a line change or an offsides play. A retrieval can turn into a controlled breakout if the attacking team concedes the zone.
Cliff Notes Takeaways
65% of all rush goals happened from the defensive zone.
44.9% of all rush goals occurred off neutral zone turnovers or defensive zone counters.
Twice as many cross-slot (royal road) passes occurred off defensive zone rushes vs. neutral zone.
52.8% of all neutral zone goals happened off turnovers vs. reloads & regroups.
61.2% of non-counterattack goals from the defensive zone happened off retrievals vs. a forecheck instead of a controlled breakout.
52.9% of all goals originated off the cycle/forecheck vs. the rush (excluding faceoffs).
Neutral zone plays accounted for only 16% of rush goals that weren’t off a turnover, defensive zone retrievals accounted for 44.1% which was the largest of the “controlled” group.
Frequency of passing plays varied by team but there wasn’t any real advantage from a league-wide standpoint. Lead-ins or stretch passes occurred commonly off neutral zone plays, though.
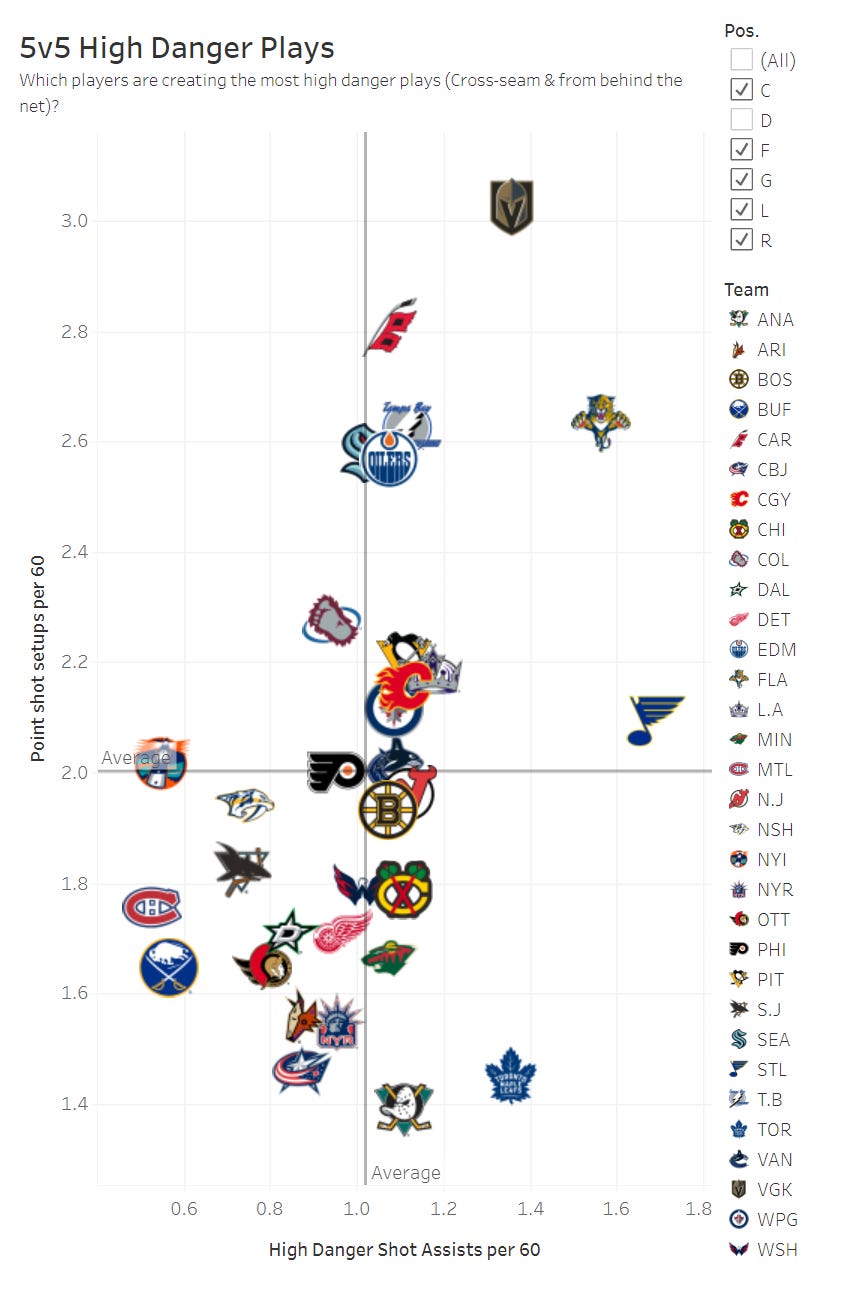
So, we have the data. My hope was that we can use this to link some of the All Three Zones together and it would have some practice use. Even if a coaching staff wouldn’t have much use for it, linking the microstats together with the context of every goal scored helps me illustarte the game better. One example I used in the presentation was the St. Louis Blues. They led the league in high danger passing plays last year & outperformed some of their expectations because they were able to score so many goals. They were also second in the league in goals off defensive zone retrievals & controlled breakouts. We now know that defensive zone rush goals included a high danger pass twice as much as one from the neutral zone, so maybe this helps put some of the puzzle pieces together to explain why they overachevied so much last year. Looking at some of the tape shows the risks & rewards.
I included clips from the Vladimir Tarasenko/Robert Thomas line because they actually led the league in goals off controlled breakouts and you can see what their gameplan was. Survive the other team’s attack enough to where they have to peel back and go for a line change. Then they can attack with no pressure & have Thomas give Tarasenko space to use his shot to his advantage or generate an odd-man rush opportunity. If there is pressure, the defenseman’s job is just to get the puck by the first layer & then they go to work. It worked for the Blues last year but there’s a feast or famine element to it because the retrieval isn’t always clean and you run the risk of more turnovers when you’re consantly slamming the puck up the boards whenever there’s pressure. It could explain why they’ve had such a drop off after such a good season & the limitations of some of the micro-level data. It helps explain what you’re seeing but it doesn’t always meant it’s going to happen that way, which is fine.
The league wide stats were also helpful as a starting point for this.
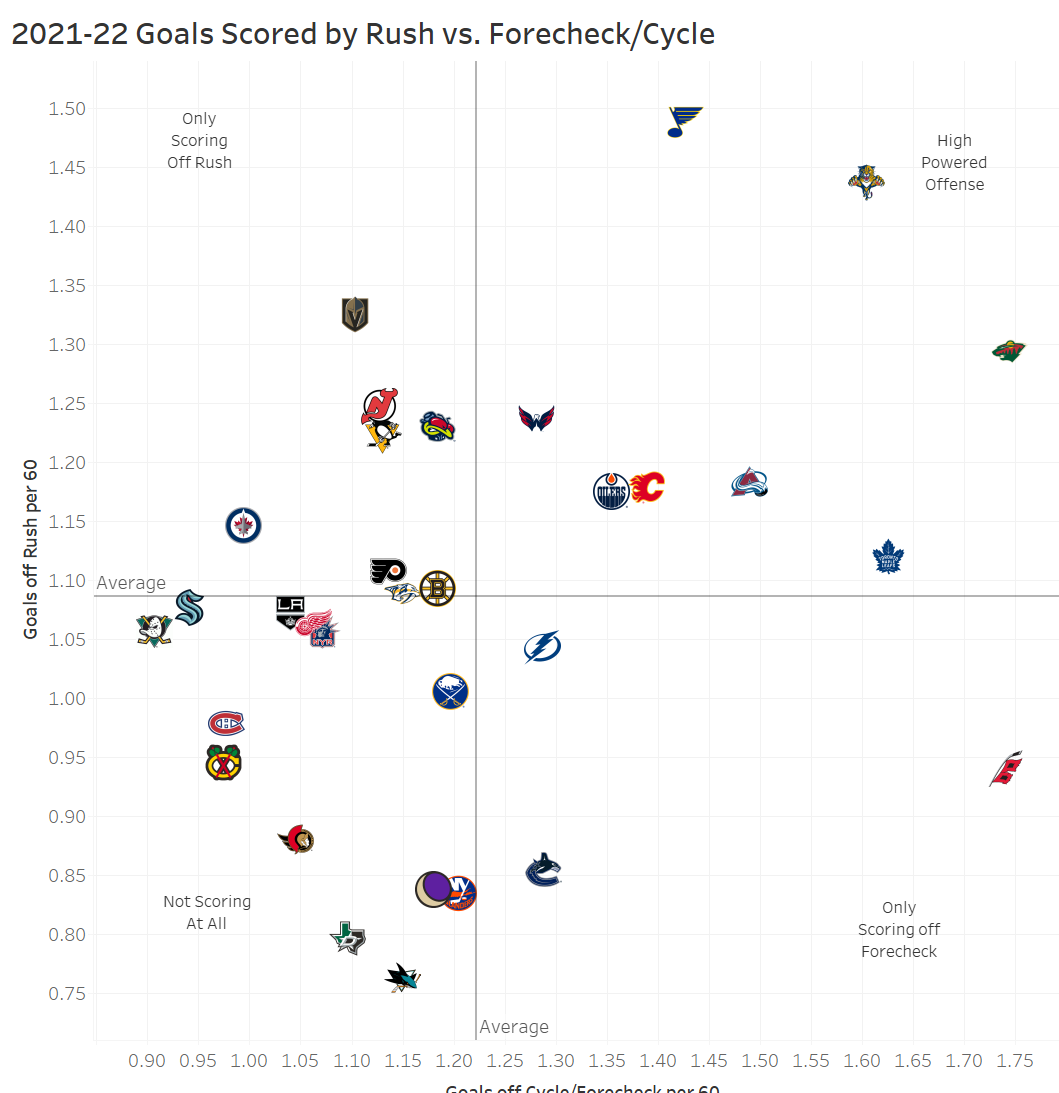
When you’re looking for a place to start, the simplier the better and this is how the data looks in its most basic form. Goals scored off the rush vs. the forecheck. Most contending teams scored well in both phases while others had one area where they excelled. Then there’s the Dallas Stars & New York Rangers who won on the back on defense and/or goaltending. You get a decent sense of how most team’s go about their business and where there might be some disconnect with the results.
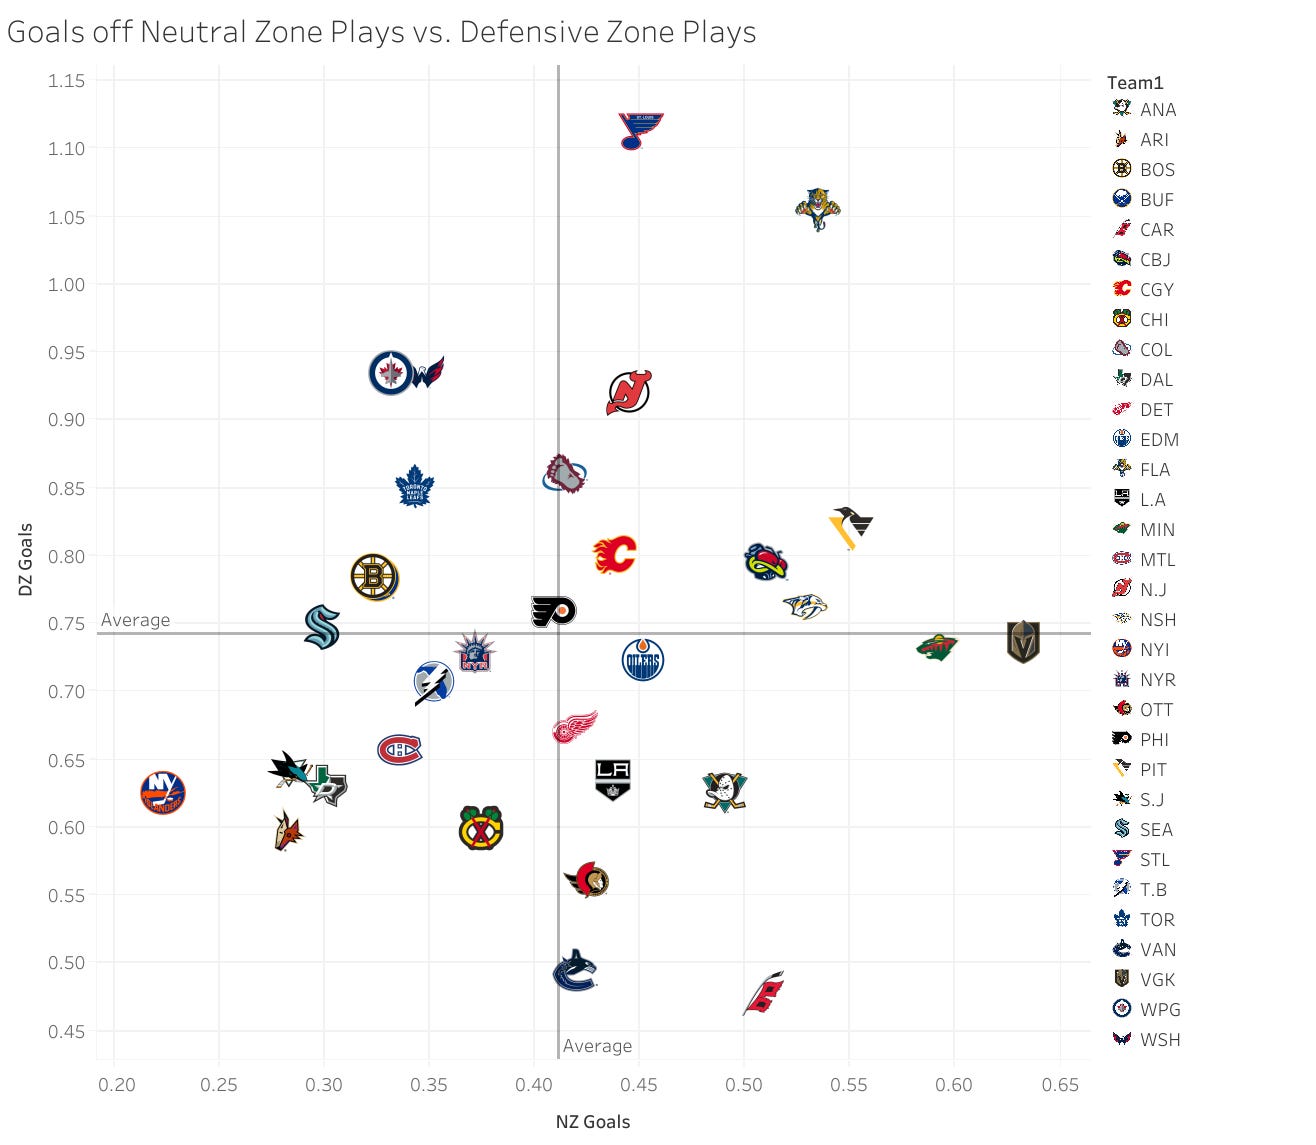
One team I broke down in the presentation was the Vegas Golden Knights, a fabulous team off the rush and one of the few who could generate goals off neutral zone plays. They also missed the playoffs and were in the bottom-half of the league in goals coming off forechecks & cycles. A majority of their rush goals also came from the neutral zone.
There was nothing wrong with how they played per se, it’s just that you can see that their offense was somewhat one-dimensional even with how good they were off the rush. Owning the neutral zone vs the other two might also be less optimal because so few goals originate from neutral zone plays (or at least they did last year). Something I took note of when researching this project was how good Vegas’ defenders were at “reloading” in the neutral zone to get the puck to the forwards off the rush.
This is how you wear teams down, but what kept them from being in the next tier with teams like Colorado, Minnesota and St. Louis was the lack of sustained offense. They didn’t follow-up their next shifts if they didn’t score on the initial chance and a lot of their offense came from point shots where you’re relying on a rebound or deflection. Linking this back to the All Three Zones data, you can see they rank near the top of the league in “low-to-high” plays or the “non danger zone” as I call it sometimes.
I don’t know if this is something the team had in mind when they made the coaching switch but they had maybe the easiest fix of the off-season barring any major roster facelift. They have a good team but needed a better strategy (and better health) to get the most out of a very talented forward corps. It seems to be going better this year. You might also put the Winnipeg Jets into this category, except most of their goals came off counter-attacks instead of regroups and I’m not nearly as high on their roster as Vegas and the Pittsburgh Penguins who had a very similar profile to Vegas but was more effecient at generating goals from the defensive zone & had better special teams.
It’s probably not the end-be-all for analysis, but if you’re a fan looking for a quick “what’s wrong with my team?” reference point, this is something that could be useful and less intimidating than pulling up a large spreadsheet of microstats with no idea where to begin.
Further Studies
There’s more I’d like to explore with this. Studying only goals is tricky because they’re rare events, but it does help you find a signal through all the noise & datapoints you get with microstats. That and finding a main point & circling back to the details is how I work best. I’d love to revisit this in a few months to see how these results hold up over the new season because I’m sure the leaderboard is very different. It’s also nice to add another layer to your analysis as new ideas are presented.
I added all of this data to the All Three Zones package & posted a link to it in the Discord. The Tableau charts will be posted in a few days once I (re)-organize everything. Making sense of all this data took quite a bit of work, so I need to scale it down a little. My slides from the presentation are embeded below if you’re intersted in those (shoutout to my talented wife Sara for putting these together & freeing me from PowerPoint).
Let me know if this is something you would like added to the A3Z package this year. Technically I’m already tracking this by adding which zone the shots are originating from this year, but I’d love to add more context if that’s something people will find use in. Big thanks to the Seattle Kraken (especially Alison Lukan) for putting this SEAHAC together and inviting me to present. It was great to see some of my favorite people on Twitter again and I can’t wait for the next get together.
https://www.canva.com/design/DAFTkhH22xw/view


I learned about your project when I went to SEAHAC 2019 and so many people said "allthreezones does the most incredible work." I don't know if there's anyone in the hockey data space that is doing better work right now.
You are a rock star in this community. Know that. We talk about you in hushed, revered tones behind closed doors. I was very excited to see you on the agenda and your talk did not disappoint.
I really enjoyed this read! Thanks for your work and please reach out if you ever run analysis on the women's side of hockey.